
Every number.Live.Every device.
Real-time sales, staff KPIs, product mix, and portfolio rollups — designed for operators who actually open the back office every day.
AU-hosted · Role-based access · Unlimited venues
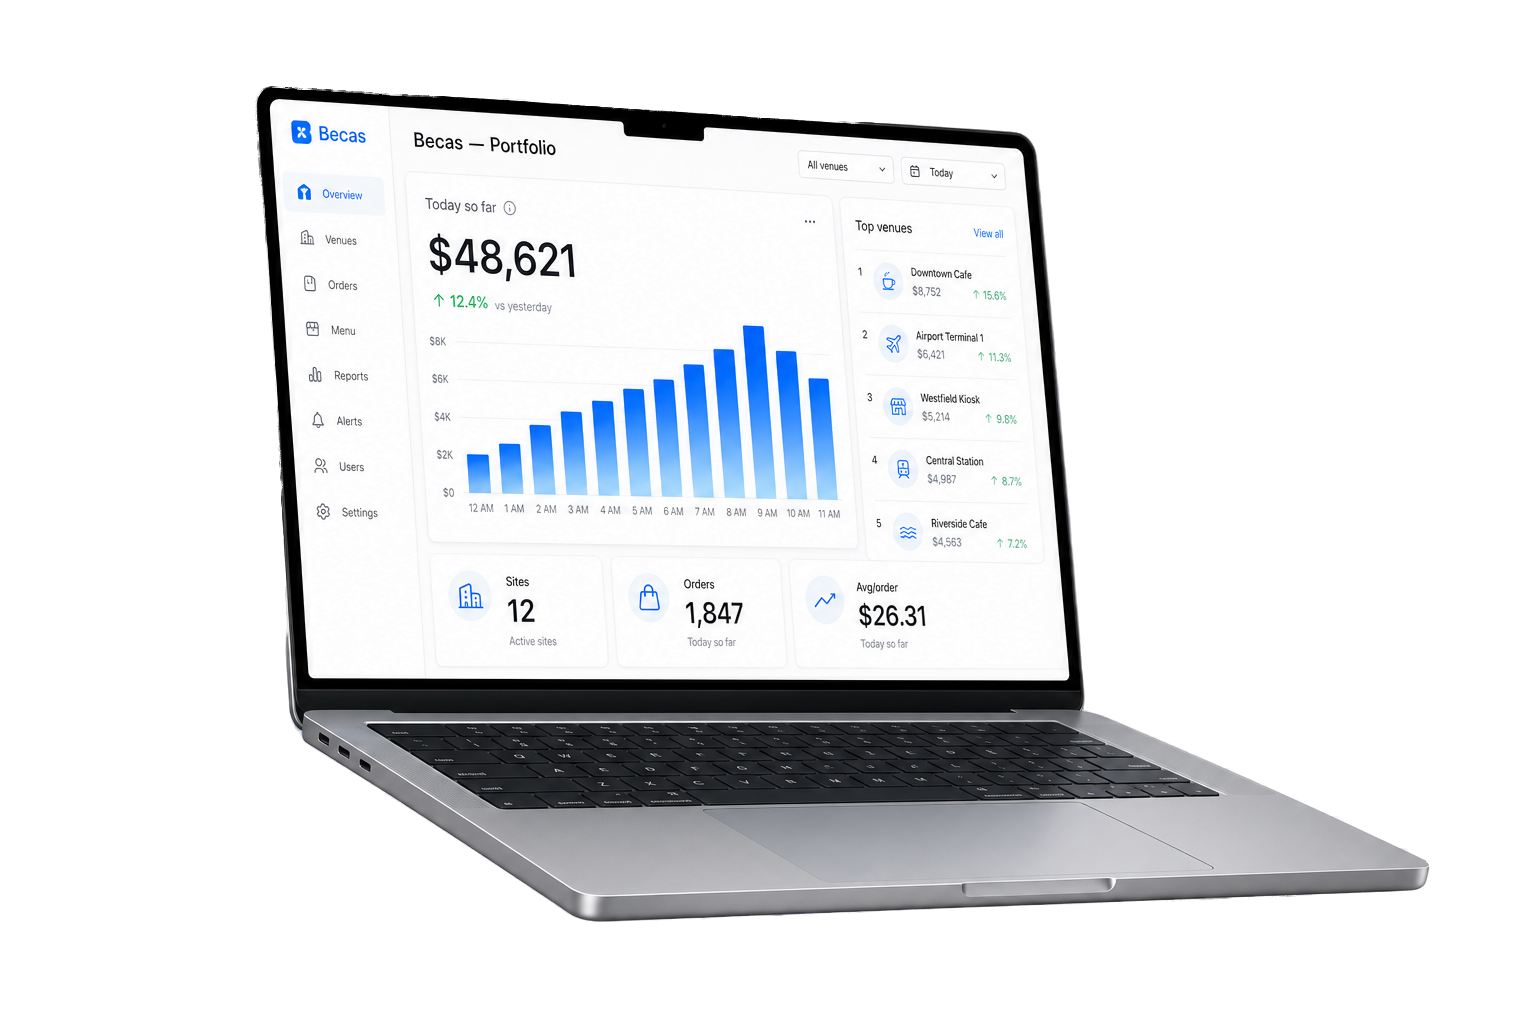
Real-time sales
Today so far. Hour by hour. Updated live.
Multi-venue rollups
One dashboard, every venue. Drill down to any shift.
Any device, anywhere
Browser-based. Designed mobile-first. AU-hosted.
Role-based access
Owners, managers, accountants — each sees what they need.
Every number you need. Live. On any device.
Sales, stock, staff, mix, margin — updating in real time on a clean cloud back office that runs in any browser. No more 'wait until Monday'. No more CSV-to-pivot loops. Just the numbers, where you are, when you need them.
Not 200 reports nobody reads. The handful that drive decisions.
Designed for the operator on the train at 8am, the GM on the floor at 11am, and the owner at the dinner table at 9pm.

Today so far.
Hour by hour, vs last week, across one venue or twenty. Updated in seconds.

What's selling. What's profitable.
Item ranking by units, revenue, and margin. Spot the dud item before the GM does.

Sales per labour hour.
Server rankings, voids by user, shift productivity — without exporting anything.
Portfolio in your pocket.
One dashboard for every venue you run. Drill into a single site, a single shift, or a single transaction without ever leaving the back office.
- Portfolio rollup across every venue, live
- Compare sites, shifts, or product mix instantly
- Role-based access for owners, ops, and accountants
- Group-wide menus, prices, and tax rules
The back office in your pocket.
The cloud back office runs in any modern browser — desktop, tablet, or phone. Designed mobile-first so operators can check sales on the train, on a Sunday morning, or while on holiday.
Same dashboard, same data, same drill-downs — just designed to be useful on the device you actually have in your hand.
- Mobile-first design — readable on a phone
- Real-time sales tiles for at-a-glance checks
- Push notifications for sales milestones and alerts
- Secure single sign-on with two-factor authentication
Cloud reporting uptime, measured across the rolling 12 months.
The dashboard, exports, and APIs are hosted on enterprise-grade Australian infrastructure with redundant regions and round-the-clock monitoring.
Monday morning used to be three hours pulling reports out of six venues. Now it's one dashboard, before the kettle's done.
Tuned for the operators who actually use it.
Restaurants
Server sales rankings, dish mix, voids and comps — at the table-level and the shift-level.
Cafes & QSR
Hourly trends, item velocity, queue-time impacts, kiosk vs counter mix.
Bars & breweries
Pour cost vs revenue, member discount tracking, tap-vs-bottle margin, function spend.
Multi-venue groups
Portfolio rollups, group-wide benchmarks, cross-site comparisons, owner dashboards.
Priced to the number of venues you run.
Single venue, twenty venues, fifty — pricing scales with the back office, not against it. Custom integrations and accounting connectors are scoped per group.
Custom pricing — talk to sales.
User seats, venue count, accounting connectors, and custom report templates. We scope it to your group, not your single site.
Better economics with the full stack.
Cloud reporting is at its best with Becas POS, KDS, and online ordering all feeding the same dashboard. Bundling locks in better platform pricing.
Add hardware wherever you need it
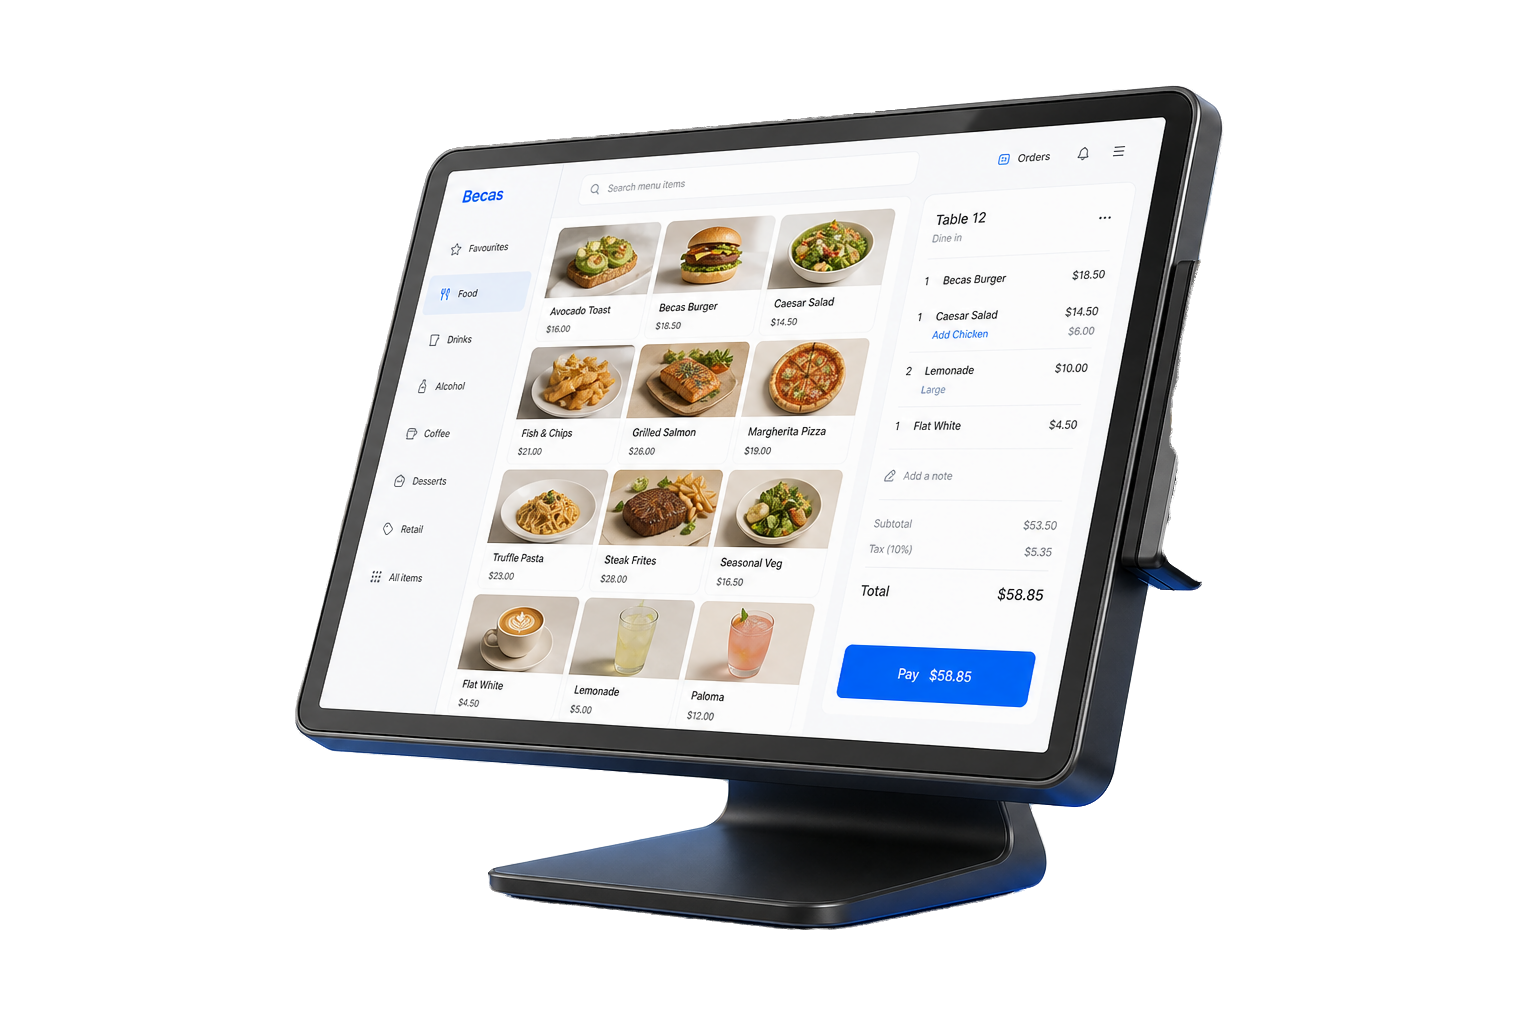
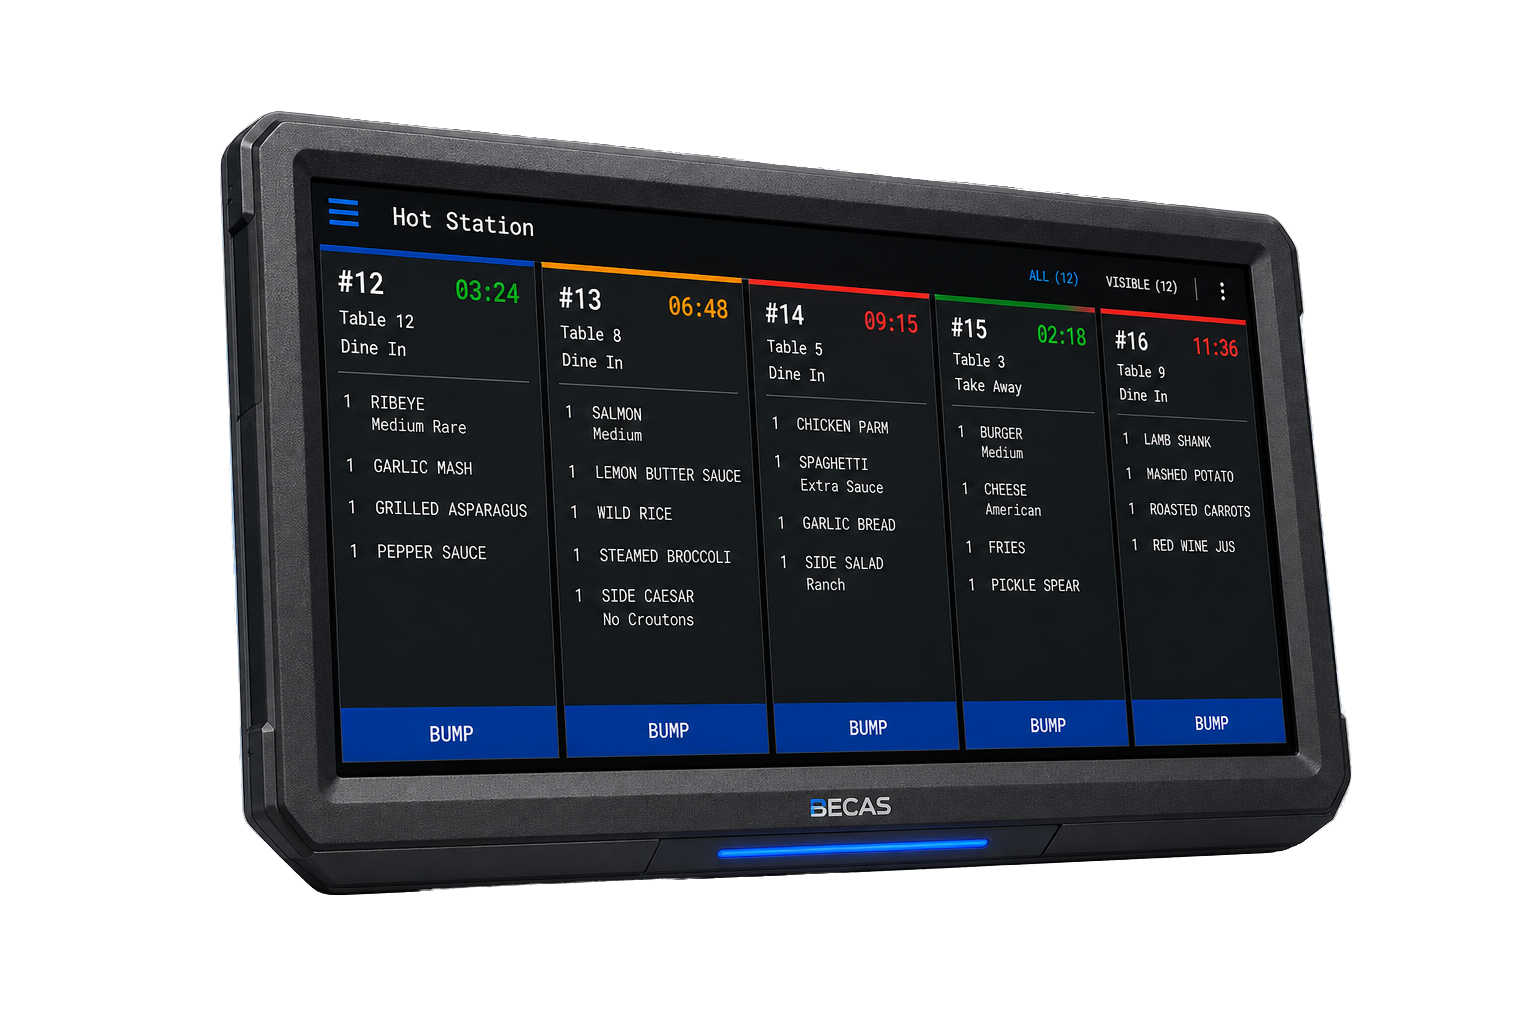
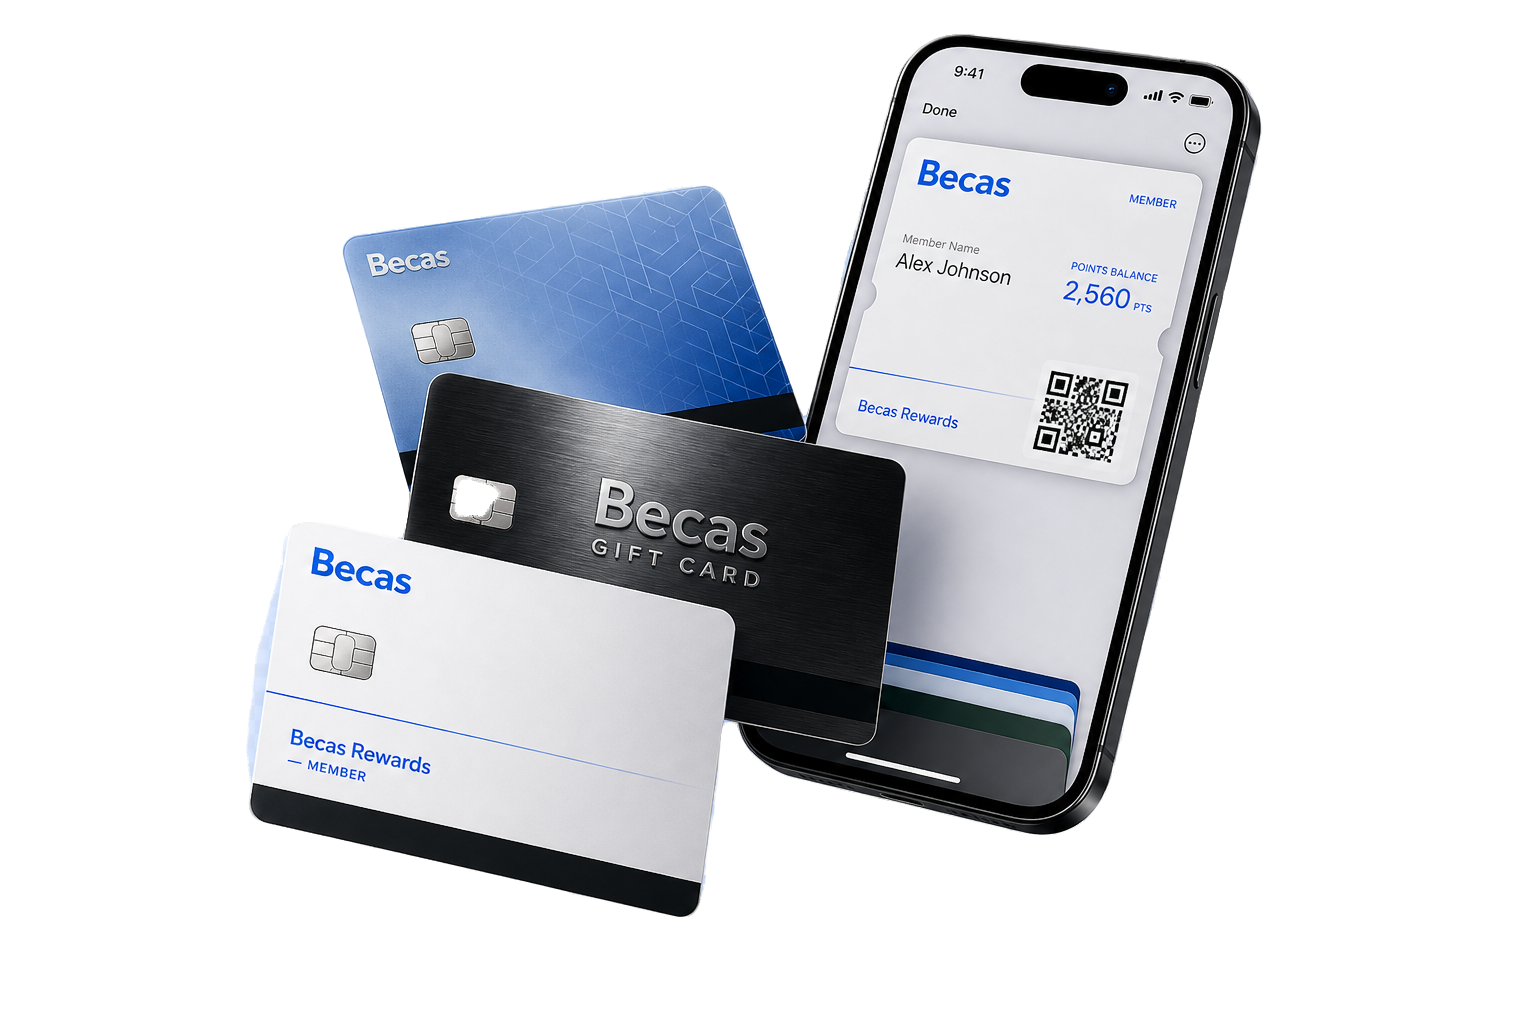
Cloud reporting reports on every part of the platform — terminals, KDS, kiosks, QR, online ordering, and loyalty.
Let's configure your reporting stack.
Tell us your venue structure, user roles, and KPI priorities. We'll set dashboards and report views your team will actually use.